Attach Local Application
Effect Demonstration
Start Debug
Start Application
DebugTools uses the Java Agent technology to implement debugging, so you must ensure that the project has been started and completed when debugging.
Attach Application
The following is the attachment local method,attach remote click to view.
Click on the  toolbar on the right side of Idea to wake up the DebugTools window. Click
 ![]() to get a list of applications that can be attached locally.
to get a list of applications that can be attached locally.

Select the application you want to debug and click the Attach button to attach the application.

After successfully attaching the app, DebugTools displays the attachment state.
L: The logo is attached to the local application,Rfor remote application.Connected: The application has been successfully attached and the service has been successfully connected.i.g.f.d.t.t.a.DebugToolsTestApplication: application name.- Attach when specifying the application name is the specified
application name. - If the application name is not specified, the Spring application
spring.application.nameconfiguration item. - When not specified, take the
Main-Classin the startup jar. - Fetch
sun.java.commandin the startup command when not found.
- Attach when specifying the application name is the specified

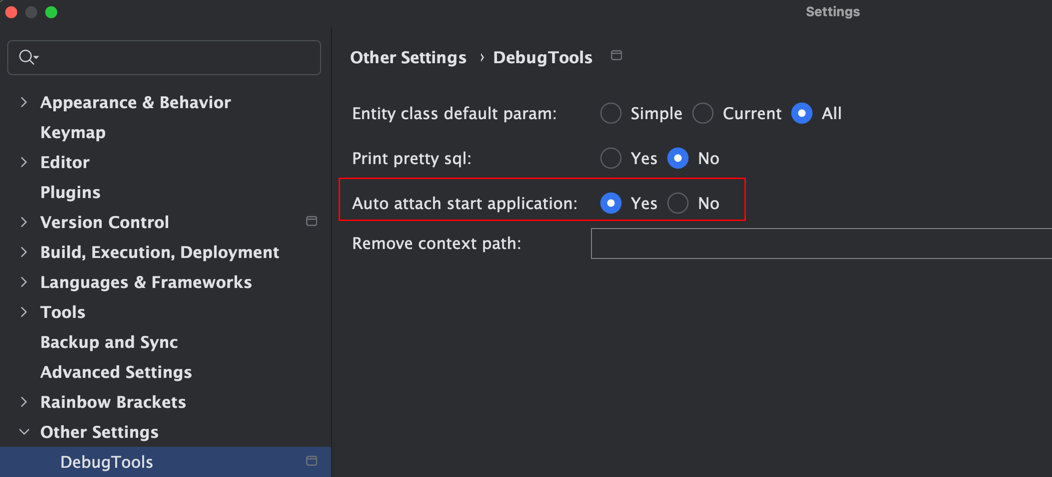
Auto Attach
Enabling the configuration can automatically attach the application launched in the current project, simplifying the need to select and attach the application each time.
Invoke Method
Wake up the context menu on the method to be invoked, click Quick Debug to wake up the debug panel.

If we want to quickly call the test method of TestService
package io.github.future0923.debug.tools.test.application.service;

import org.springframework.stereotype.Service;

@Service
public class TestService {

    public String test(String name, Integer age) {
        return "name = " + name + ", age = " + age;
    }
}
Enter the value of the parameter when calling the method
For example, name = DebugTools, age = 18, the DebugJson format will be automatically generated, click to learn more. Here we can pass the corresponding value in content.

Click the Run button to call the method.
Show Result
After the call is successful, the run result (the return value of the method) will be displayed in the DebugTools window.
- toString: Shows the return value of the method after calling the ToString method.
- json: The return value of the method is displayed by Json.
- debug: Displays the method return value in the style of type Idea Debug.

Debug start application call
If the application is started by the Debug way, the target method called has a breakpoint, and the execution result will be returned after the breakpoint is executed.
So you can start the application in the Debug way, call the method quickly through the DebugTools, and add the breakpoint to debug the target method.