
Print SQL Statements And Execution Time
Purpose
When debugging business code, you often need to confirm the actual SQL statement, SQL parameters, and execution time. Many connection pools, ORM frameworks, or logging frameworks have their own SQL logging options, which often means changing configuration or even code.
DebugTools intercepts SQL execution at the JDBC layer by modifying database driver bytecode. It does not depend on a specific connection pool or ORM. As long as the application uses an adapted JDBC driver, DebugTools can print SQL statements and execution time at runtime.
Currently adapted JDBC drivers:
Enable SQL Printing
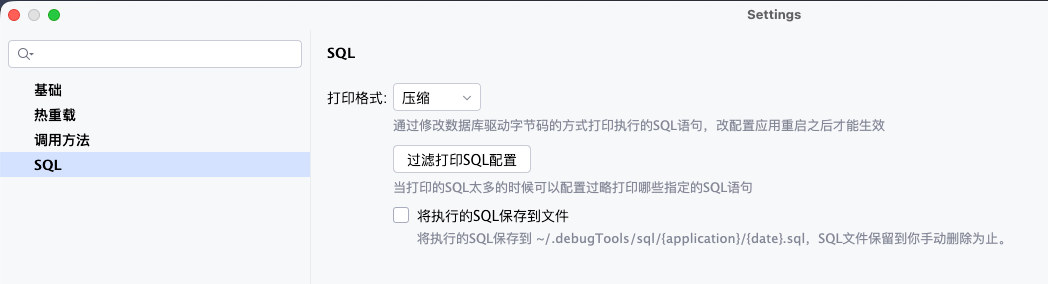
Open Settings -> Other Settings -> DebugTools -> SQL, then select a SQL printing mode from Print format.
| Print format | Description |
|---|---|
Pretty | Format SQL before printing. Useful for reading long SQL statements. |
Compress | Compress SQL into one line before printing. Useful for reducing log size. |
No | Disable SQL printing. |
TIP
After changing Print format in Settings, restart the application so DebugTools can enhance the database driver bytecode. After the application starts and attaches successfully, you can dynamically switch the SQL printing mode on the connection card.
After enhancement succeeds, the application log prints content similar to:
Print xxx(mysql/oracle/...) log bytecode enhancement successfulExample output:
Execute consume Time: 3 ms; Execute SQL:
SELECT
    id,
    name,
    age,
    version
FROM
    dp_user
WHERE
    id=1;
Filter SQL
When SQL logs are too noisy, click Filter SQL print config to print only specified packages or SQL statements, or to ignore specified packages or SQL statements.
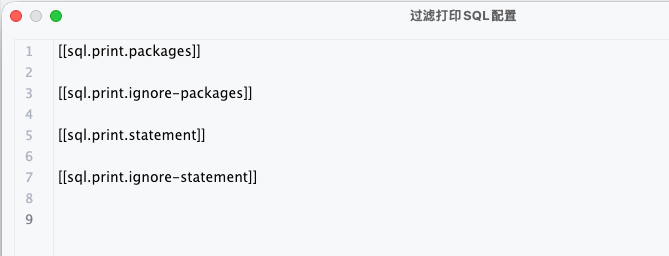
The configuration file has four fixed sections:
| Section | Description | Priority |
|---|---|---|
[[sql.print.packages]] | Print only SQL whose call chain matches these package-name regular expressions. | Higher than sql.print.ignore-packages. |
[[sql.print.ignore-packages]] | Ignore SQL whose call chain matches these package-name regular expressions. | Ignored when sql.print.packages is configured. |
[[sql.print.statement]] | Print only SQL statements that match these SQL regular expressions. | Higher than sql.print.ignore-statement. |
[[sql.print.ignore-statement]] | Ignore SQL statements that match these SQL regular expressions. | Ignored when sql.print.statement is configured. |
Package rules match the current execution thread stack. For MyBatis, MyBatis-Plus, and JPA proxy classes, DebugTools tries to restore the corresponding Mapper or interface package name before matching.
SQL rules match the final SQL text. The configuration supports regular expressions. Blank lines, lines starting with #, and lines starting with ; are ignored.
Example:
[[sql.print.packages]]
com.example.order
com.example.user

[[sql.print.ignore-packages]]
com.example.health

[[sql.print.statement]]
select .* from user

[[sql.print.ignore-statement]]
select 1
TIP
The target application watches the filter configuration after it has been loaded. Changes to the configuration file are reloaded automatically, so adjusting filter rules does not require restarting the application.
Save SQL Files
After enabling Save executed SQL to file, DebugTools appends printed SQL to the current user's home directory:
~/.debugTools/sql/{application}/{yyyy-MM-dd}.sqlEach record contains the execution time, database type, elapsed time, and SQL text:
-- 2026-05-18 14:30:12 | mysql | 12ms
select * from user where id = 1;
SQL files are kept until you delete them manually. Open SQL History in the DebugTools tool window to view, open, reveal, or delete these SQL files.
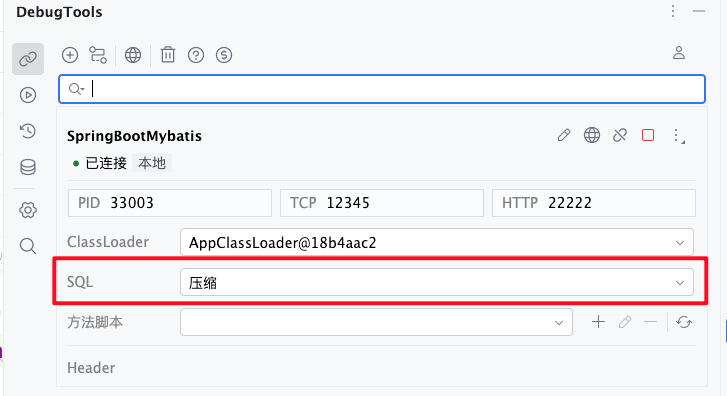
Dynamic Switching On Connections
If SQL printing enhancement was enabled when the application started, you can switch the current connection's SQL printing mode from the SQL dropdown on the connection card. The operation is sent to the target application and takes effect immediately for that connection.
If SQL printing enhancement was not enabled when the application started, switching the printing mode on the connection card cannot add the missing database driver bytecode enhancement. Restart the application after enabling SQL printing.
Warning
Not recommended for production
DebugTools implements SQL printing by modifying database driver bytecode. Different drivers, connection pools, or runtime environments may have compatibility risks, so enable it carefully in production.