Method Duration
When a method takes too long to execute, you can quickly view the method's duration using DebugTools.
Configuration
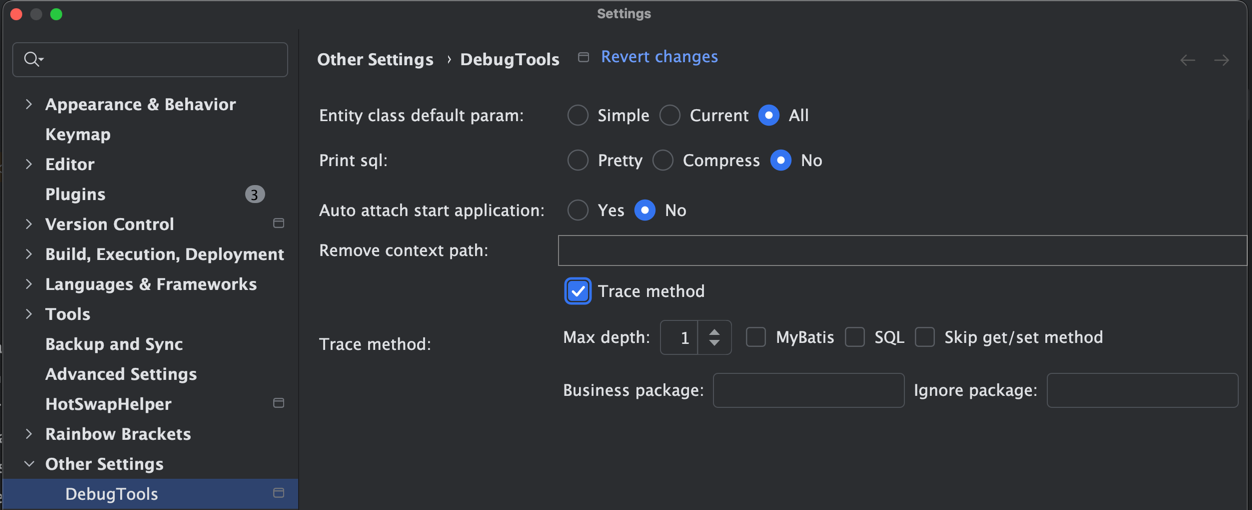
Trace method: Whether to trace method duration.Max depth: Maximum stack depth.MyBatis: Whether to trace MyBatis Mapper method duration.SQL: Whether to trace SQL method duration.Skip get/set method: Whether to skip get/set methods.Business package: Regular expression matching a business package path. Only methods matching this path will be traced.Ignore package: Regular expression matching an ignore package path. Methods matching this path will not be traced.
::: Tip
- This configuration is used when the debug panel is activated. If this method has not been previously configured, it will automatically read the default value.
- If you need to print SQL, you need to select the SQL configuration during startup (because SQL is bytecode modified at startup). You can enable either the print SQL or trace method SQL configuration.
Debug Panel
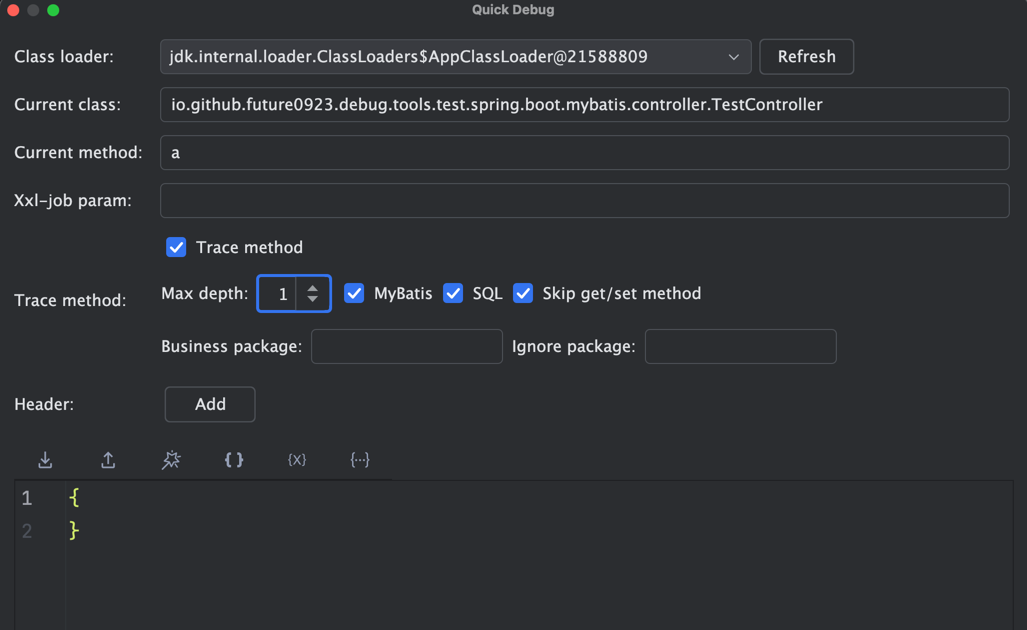
Trace method: Whether to trace method execution timeMax depth: Maximum stack depthMyBatis: Whether to trace MyBatis Mapper method execution timeSQL: Whether to trace SQL method execution timeSkip get/set method: Whether to skip get/set methodsBusiness package: Regular expression matching business package paths. Only methods matching this path will be traced.Ignore package: Regular expression matching ignore package paths. Methods matching this path will not be traced.
::: Tip
- This configuration applies to the current method. - If you need to print SQL, you need to select the SQL configuration in the configuration before starting. You can enable either the print SQL option or the trace method SQL configuration.
Manual Configuration
Normally, a method will call many methods. If the Max Depth is too high, bytecode conversion will take a long time.
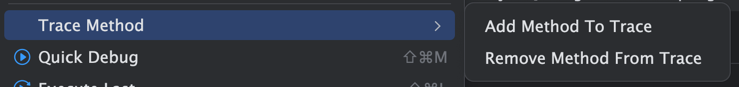
In this case, it is recommended to manually add methods to trace. Right-click in the method body to add or remove methods from trace.
Add Method To Trace: Add a traced methodRemove Method From Trace: Remove a traced method
Manually added methods will display the following icon:
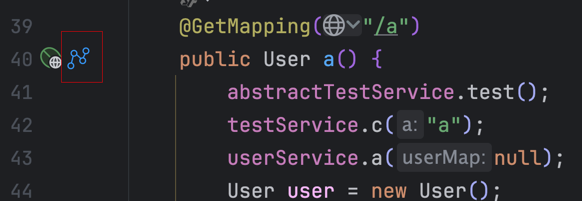
Click the icon or use Remove Method From Trace to remove the current method from trace.
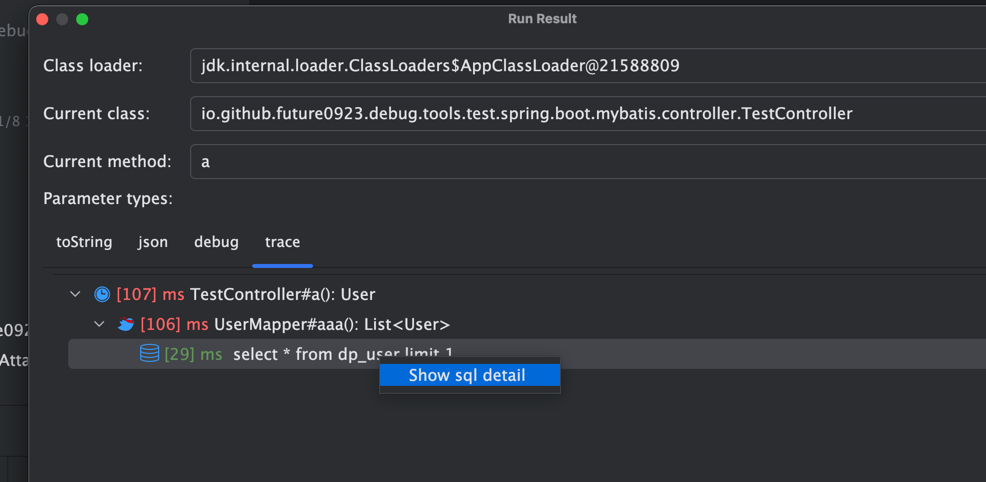
Displaying Results
Use the trace type to view the execution time of a method.
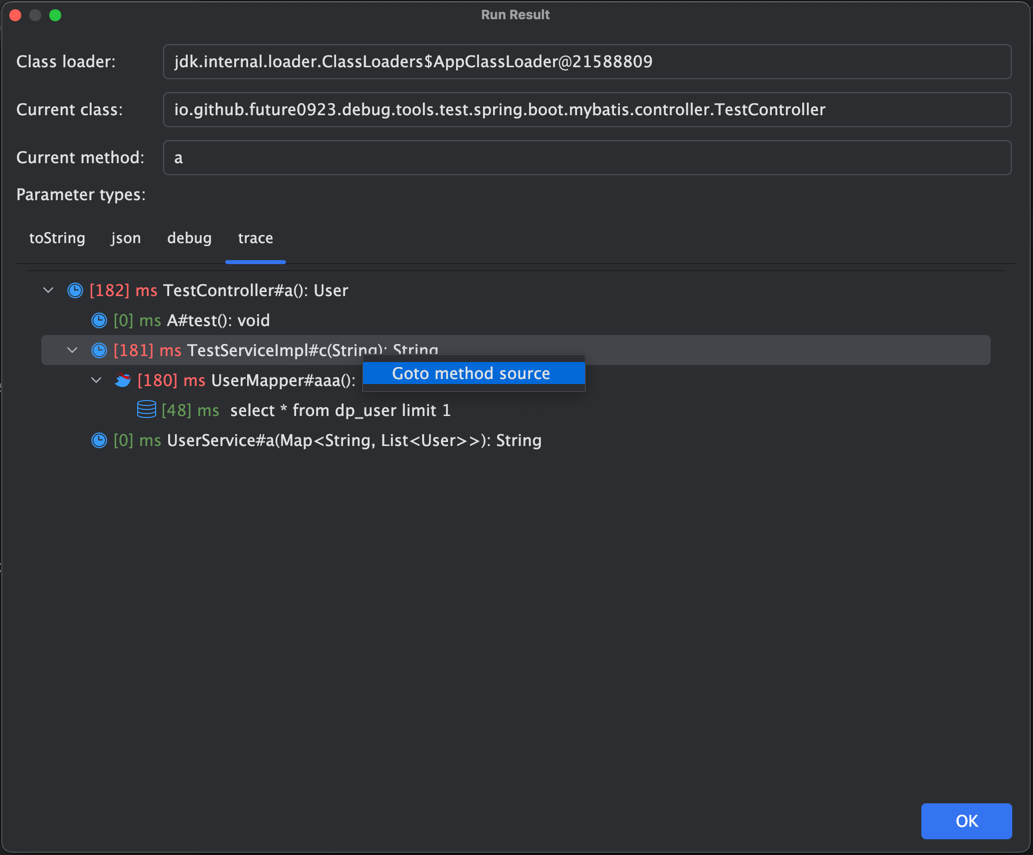
Goto method source: Use the right-click menu on a method to jump to the corresponding method.
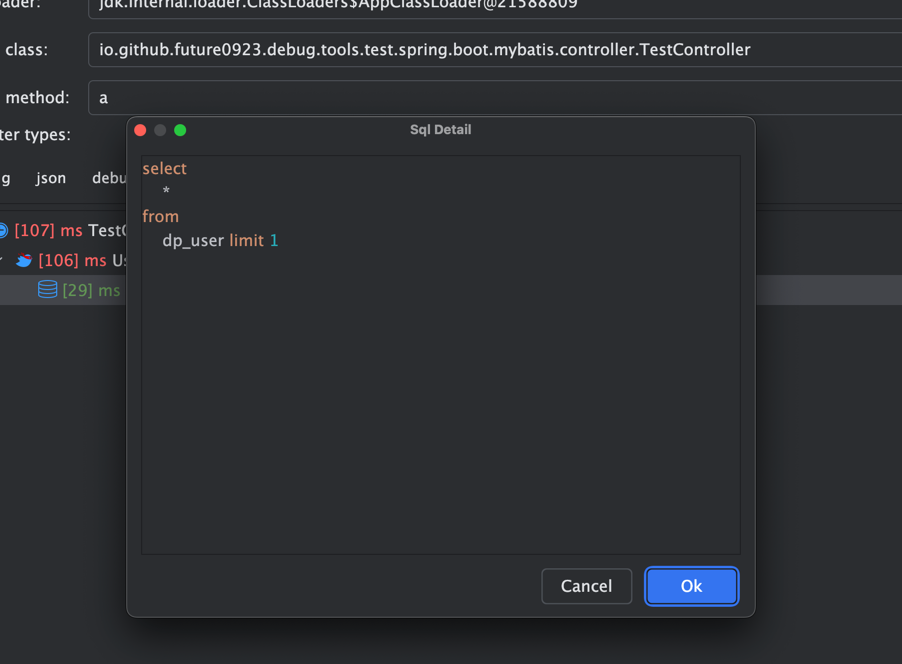
Show SQL detail: Use the right-click menu on a method to view the SQL statement in full-screen format (double-clicking is also possible).