Invoke Method History
Enable
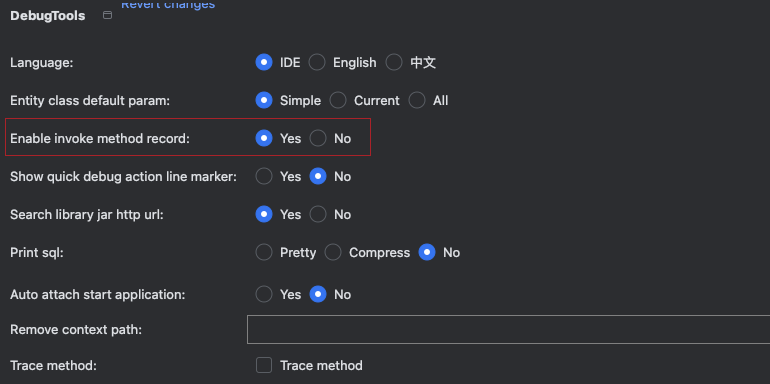
Enabling this configuration will generate a record of method calls.
Call History List
Click the  toolbar on the right side of Idea to open the DebugTools window and view the call history list (up to 500 entries).
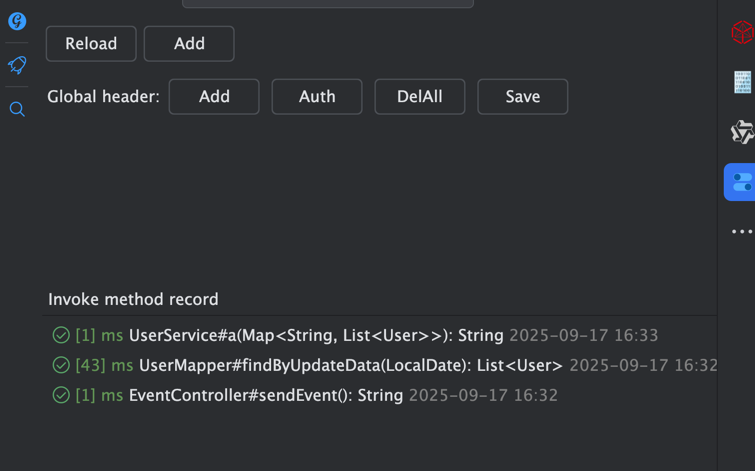
Display format:
[Execution status icon] [Execution time] [Class name]#[Method name](parameter type): [Return value type] [Declaration exception] [Execution time]Menu
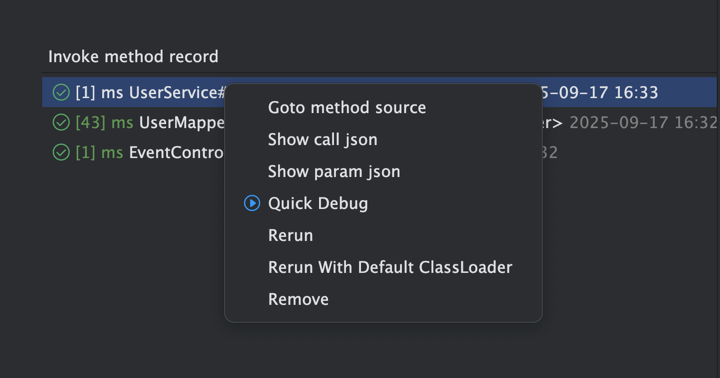
Goto method source: Jump to the currently selected source code locationShow call json: Displays the JSON information for the currently selected callShow param json: Displays the JSON information for the method parameters for the currently selected callQuick Debug: Use the currently selected parameter call record to activate the debug panel. Double-clicking the left mouse button also works.Rerun: Reruns the currently selected method with the same parameters as before.Return With Default ClassLoader: Reruns the currently selected method with the currently selected default class loader, with the same parameters except for the class loader.Remove: Removes the currently selected call record.