
Method Invocation
The method invocation page is an independent request workspace for one target method. After a method is opened, DebugTools creates a request tab in the tool window. You can select the attached application and ClassLoader, fill in parameters, headers, scripts, and other request data, then view the invocation result.
Open Method Invocation
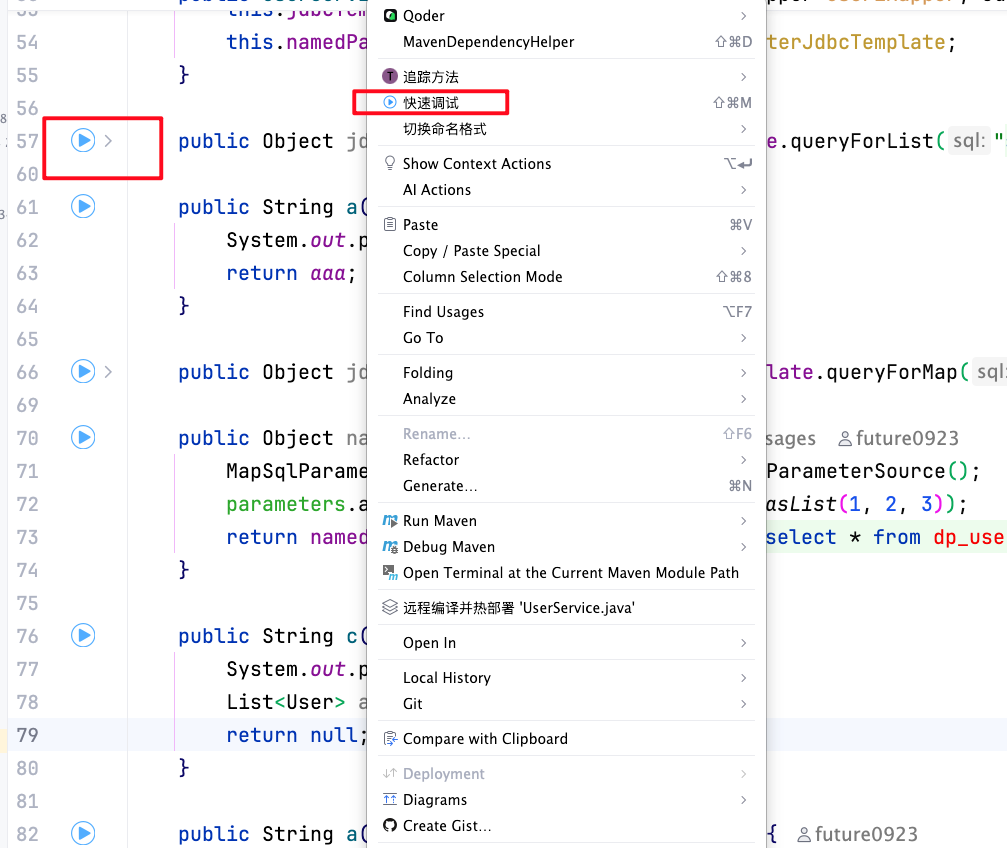
Click the method invocation entry from the method gutter icon or the context menu inside the method body. DebugTools creates a request tab for the current method. The tab name uses ClassName#methodName; hover over the method input to view the full class name, parameter types, and return type.
You can open multiple method requests at the same time. When switching tabs, each method keeps its own parameters, target connection, and result area, which is useful when repeatedly verifying several Service, Mapper, or Job methods.
Window Toolbar
The outer method invocation workspace is hosted by the DebugTools tool window. The vertical toolbar switches between connection management, method invocation, invocation history, SQL history, and other pages. After switching to the method invocation page, the top area shows the opened request tabs.
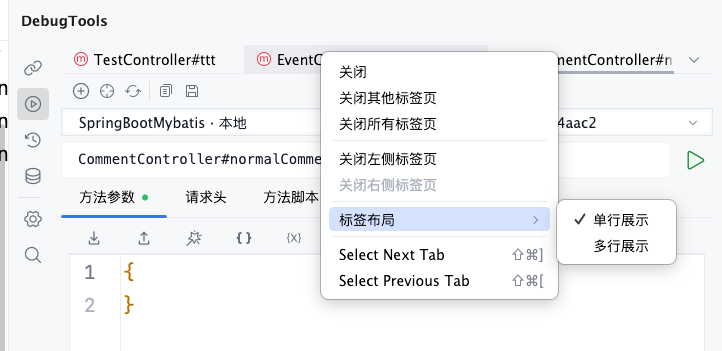
The request tab context menu manages tabs in the current method invocation workspace:
| Menu | Description |
|---|---|
Close | Close the currently selected method request tab. |
Close Other Tabs | Keep the current tab and close the other opened method request tabs. |
Close All Tabs | Close all request tabs in the current method invocation workspace. |
Close Tabs to the Left | Close request tabs opened before the current tab. It is unavailable when there are no closable tabs on the left. |
Close Tabs to the Right | Close request tabs opened after the current tab. It is unavailable when there are no closable tabs on the right. |
Tab Layout -> Single Row | Display all request tabs in one row. When there are many tabs, switch through scrolling or the overflow menu. |
Tab Layout -> Multiple Rows | Wrap request tabs into multiple rows when there are many tabs, making more opened methods visible directly. |
The default tab layout can also be configured in Settings | DebugTools | Method Invocation. Changes from the context menu take effect immediately for the currently opened method invocation workspace.
Page Toolbar
The toolbar on the method invocation page only affects the current request tab.
| Icon | Button | Description |
|---|---|---|
Attach | Open the local JVM process list. After attaching, the application appears in the application dropdown. | |
Locate current method source | Jump back to the source location of the current method. | |
Refresh | Reload applications and ClassLoaders, then detect the suitable connection for the current method again. | |
Copy request parameters | Copy the current parameter JSON. The content is the same as the visible text in the method parameter tab. | |
Save request parameters | Save the current request form to the method parameter cache. It is restored the next time the same method is opened. | |
Request | Invoke the method with the current application, ClassLoader, and request form. |
After clicking ![]() , the request button enters the
, the request button enters the Requesting... state. When a new request starts, the previous result is cleared so old results are not mixed with the current request.
Select Target Application
The top area contains two dropdowns: application and ClassLoader.
- The application dropdown shows applications that are attached locally or connected remotely in the current project. The format is
ApplicationName · LocalorApplicationName · Remote. If a connection has a remark, the remark is shown first; hover to view details. - The ClassLoader dropdown is bound to the selected application. When the application connection is normal, DebugTools refreshes it and selects the remote default ClassLoader automatically.
- When multiple connections exist, the page tries to automatically select the application and ClassLoader that can load the class containing the current method.
TIP
- In most cases, you do not need to select the ClassLoader manually.
- If the wrong ClassLoader is selected, common symptoms are that the target JVM cannot find the class, Bean, or method.
- For multi-module applications, plugin-based applications, and Spring Boot DevTools scenarios, prefer the ClassLoader that can load the current business class.
- When IDEA starts the application with the
shorten command lineclasspath file mode, the default ClassLoader may also change.
Request Data
Method Parameters
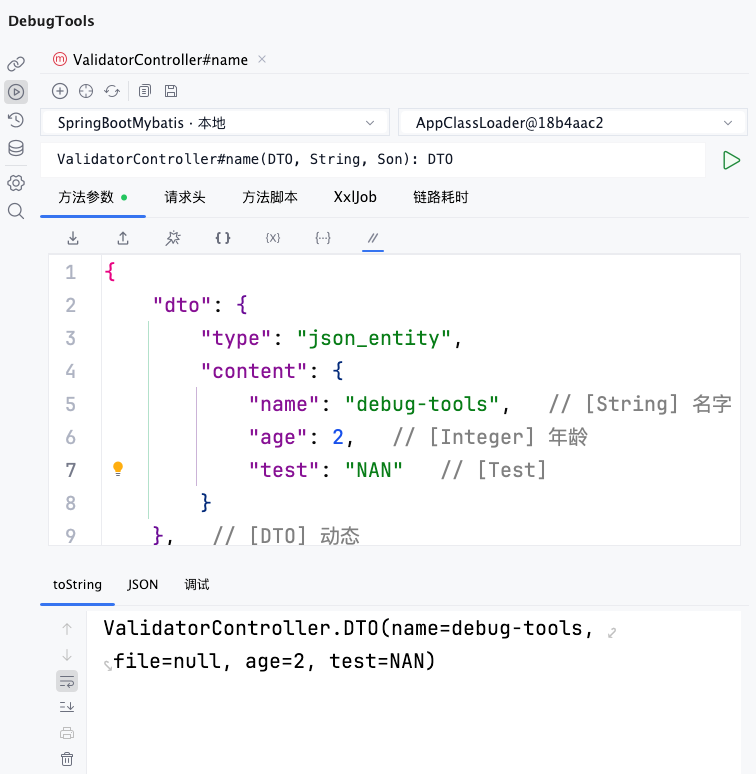
Method parameter JSON is the input protocol used by DebugTools when invoking Java methods. Each field in the root object corresponds to one method parameter. The field name is usually the Java method parameter name, and the value contains fixed type and content fields:
{
  "[parameterName]": {
    "type": "[type]",
    "content": "[content]"
  }
}
type decides how the target JVM converts content into the real Java argument.
Common types include simple, json_entity, enum, bean, lambda, request, response, file, and class.
For the full format, type examples, completion behavior, and editor actions, see Method Parameter JSON.
Headers
The Headers tab is used to fill in headers for the current method invocation. Only enabled headers are included in the request. It is useful for authentication, tenant, language, gray release, and other context values.
DebugTools supports headers at three levels: method-level, connection-level, and project-level. The final priority is Method-level > connection-level > project-level. For configuration entries, merge rules, and usage recommendations, see Request Headers.
Method Script
The Method Script tab selects a Java script.
The script can execute corresponding code before the target method call, after it returns, when an exception occurs, and after final cleanup.
It helps process parameters, results, or context, and is useful for temporarily preparing login state, environment variables, ThreadLocal, and other prerequisites.
For script entry points, template methods, execution order, and examples, see Method Pre/Post Scripts.
XxlJob
The XxlJob tab is used to fill in the XXL-JOB scheduling parameter. The content is sent with the current request as a plain string.
Before the target JVM executes the method, DebugTools writes this string into the XXL-JOB context. If the target method reads the task parameter through XXL-JOB APIs such as XxlJobHelper.getJobParam() or XxlJobContext.getXxlJobContext().getJobParam(), it reads the value filled in this tab.
The content entered here is not part of the method parameter JSON and is not passed as a target method argument. If the method itself has parameters, you still need to fill them in the Method Parameters tab.
For ordinary methods, or methods that do not depend on XXL-JOB context, leave this tab empty. When it is empty, DebugTools does not set an extra XXL-JOB parameter for this invocation.
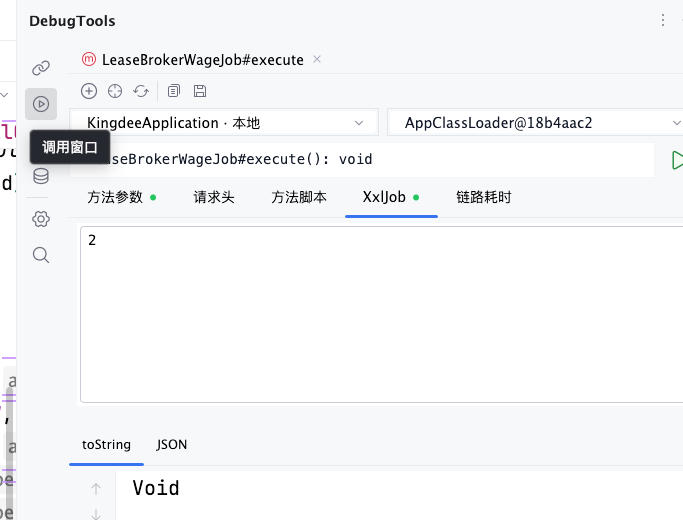
In the screenshot, LeaseBrokerWageJob#execute() is invoked with 2 in the XxlJob tab. If this task method reads the XXL-JOB task parameter internally, it receives the string 2; the result area returns Void, meaning the task method has completed.
Trace
The Trace tab is used to enable trace collection for the current invocation. After enabling it, you can configure the maximum depth, whether to record MyBatis and SQL, whether to skip getter/setter methods, and use business packages or ignored packages to narrow the collection range.
After the invocation completes, the result area shows a trace view for inspecting the method call chain, SQL, and execution time. For detailed options, trace tree operations, and usage recommendations, see Trace.
Reactive
When the target method returns Flux, Mono, org.reactivestreams.Publisher, or java.util.concurrent.Flow.Publisher, the page shows the Reactive tab. These settings only affect how the tool window displays the result; they do not change the remote method execution logic.
When debugging LLM, Agent, SSE, and other AI streaming APIs, it can extract fragmented events and join them into a continuous result, which makes it especially useful for diagnosing AI streaming output.
Display after return can show either the event list or extracted result. When using extracted result, Extract path supports JSON Path for extracting and joining values from streaming data, such as $.content. You can also use $[event].path to extract only fields from a specified SSE event.
For detailed display behavior, extract path rules, and subscription cancellation, see Reactive.
View Results
Before the request returns, the result area shows No request result. After the response arrives, the result area switches to a normal result, exception result, or Reactive streaming result depending on the return type. For a normal invocation, if trace collection is enabled, an additional Trace tab is shown.
toString
toString is the default tab after a normal successful invocation. It is used to quickly inspect the return value as text.
- A
voidmethod showsVoid. - A
nullreturn value showsNULL. - Numbers, strings, booleans, dates, and other simple types are shown as converted text.
- Object return values show the object's own
toString()result. If the business class does not overridetoString(), this usually looks likecom.example.User@xxxx.
JSON
The JSON tab converts the result into JSON text.
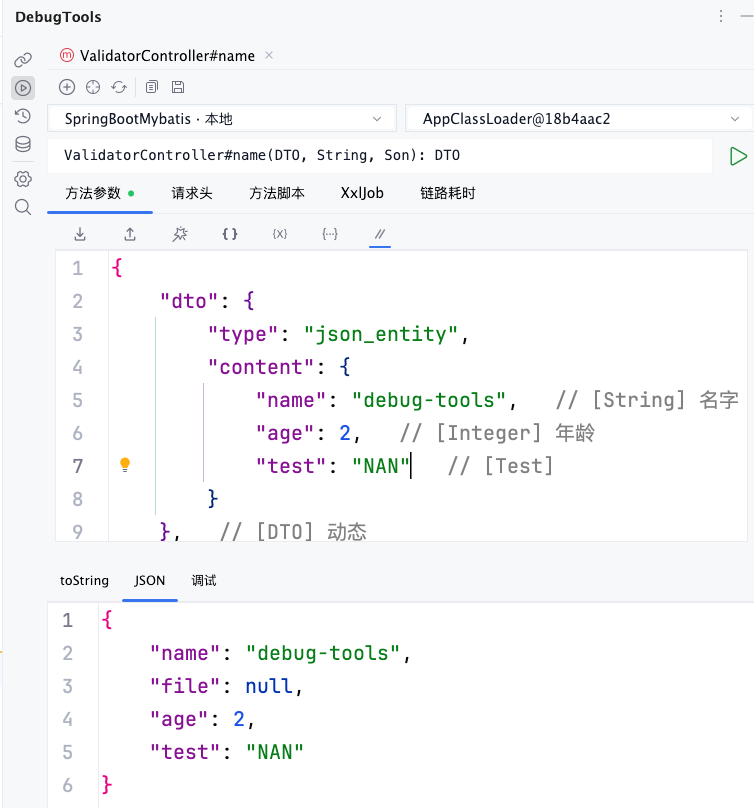
Different return types are displayed slightly differently:
voidis displayed as a result object containingVoid.nullis displayed as a result object containingNull.- Simple types are wrapped in the
resultfield. - Object types are loaded from the target application and serialized when you switch to the
JSONtab.
Debug
The Debug tab displays the return result as an expandable tree. It is useful for inspecting object fields, collection elements, map entries, and nested structures.
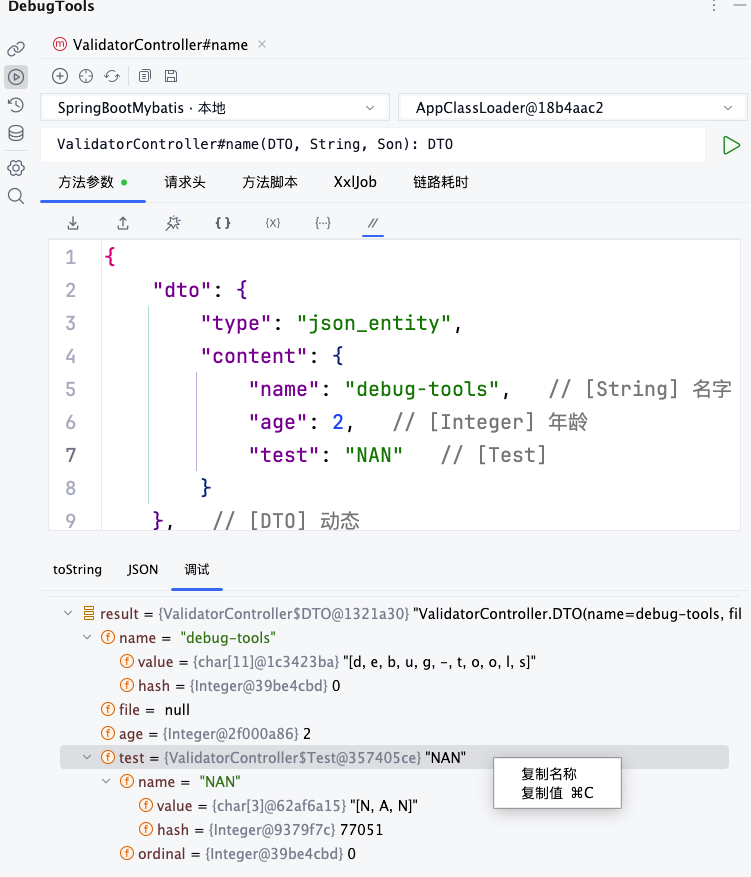
For normal objects, details are loaded on demand when you switch to the Debug tab. After expanding tree nodes, you can continue inspecting child fields and values. This is usually more direct than copying the whole JSON when you only need to verify one field.
TIP
voidandnullreturn values cannot be expanded in the debug tree.- Simple types are displayed as a
resultleaf node.
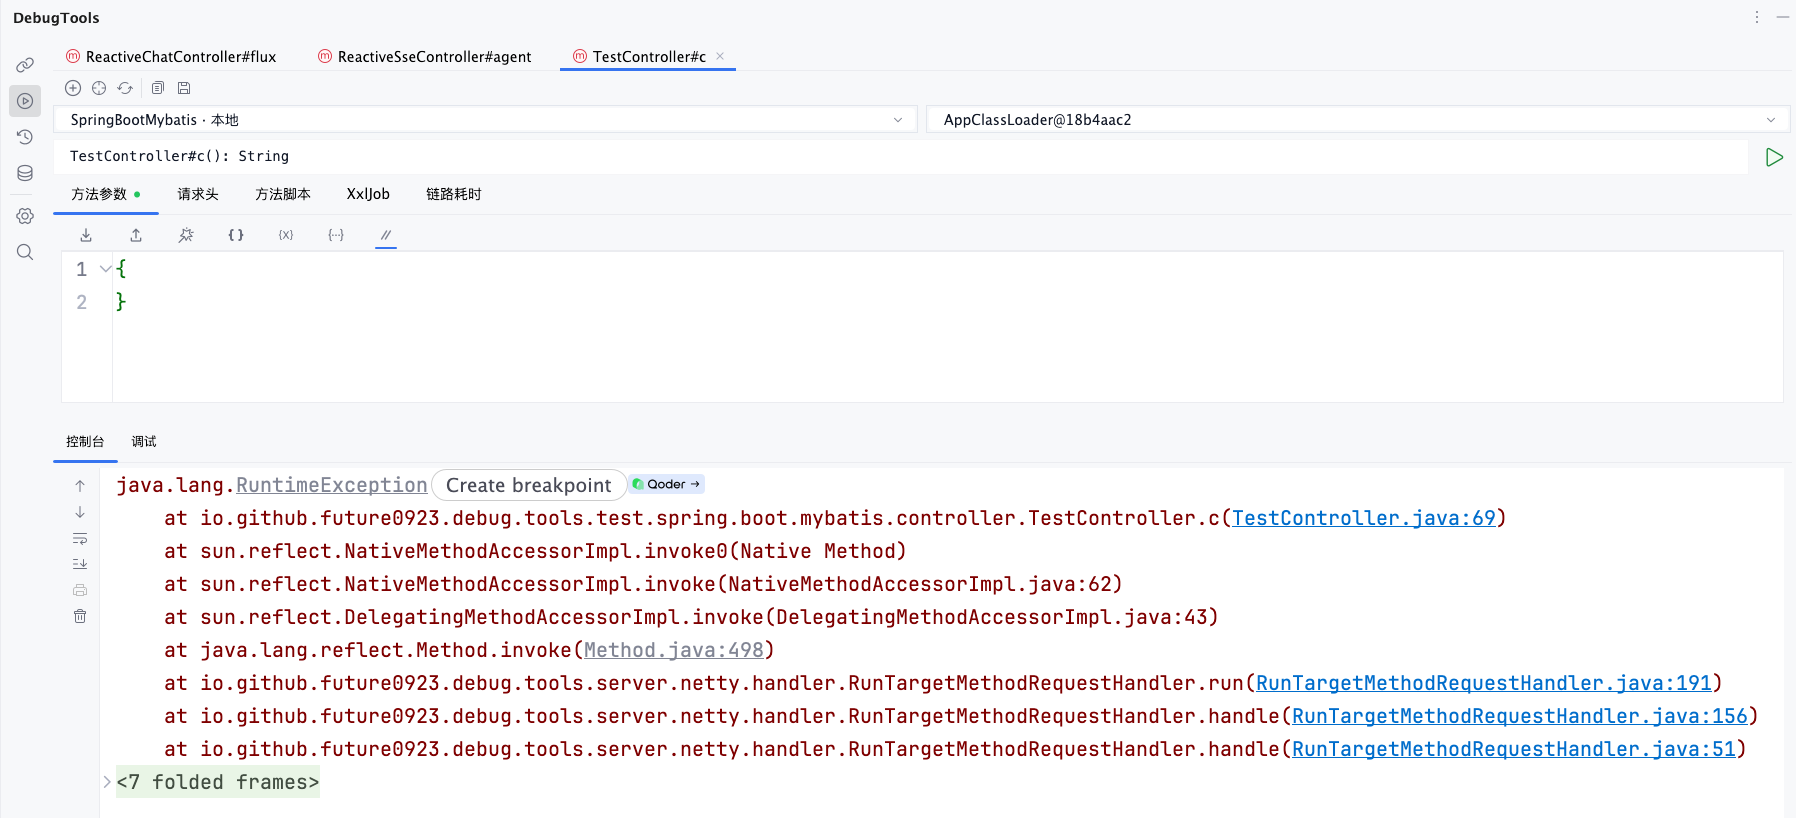
exception
When the method throws an exception, parameter parsing fails, or the target class or method cannot be found, the result area shows an exception result. Exception results contain two tabs: Console and Debug.
- The
Consoletab shows the exception stack trace, which is useful for copying error information and locating the class and line number where the error was thrown.
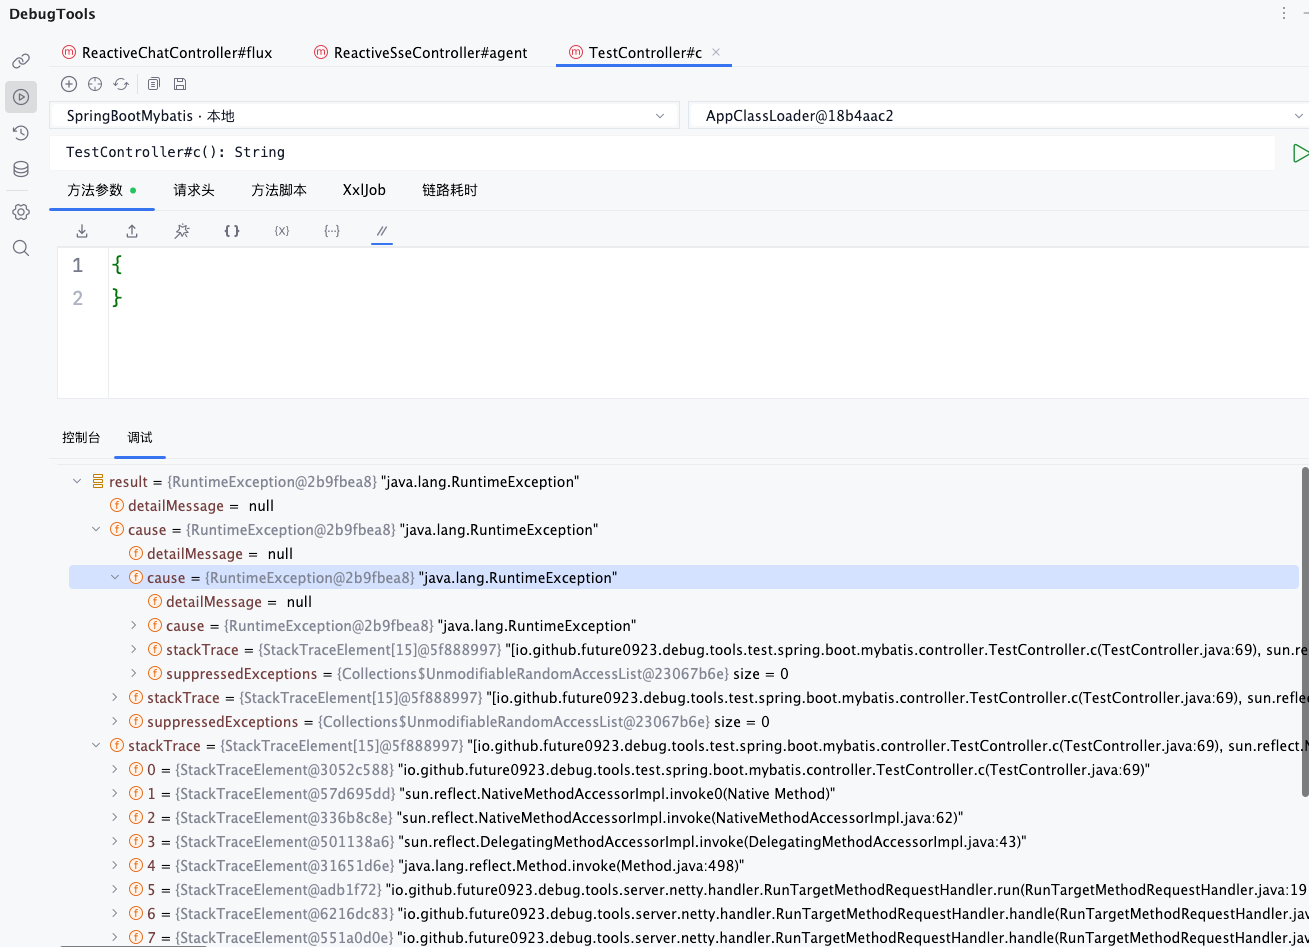
- The
Debugtab shows exception object details, including the exception type, message, cause, and suppressed exceptions.
Exception results do not enter the normal toString or JSON tabs. After fixing parameters, headers, ClassLoader, or target method code, click ![]() again to clear the old exception and show the new result.
again to clear the old exception and show the new result.
Trace
The Trace tab is used to inspect the Trace tree collected for the current method invocation. It is shown only after Trace method time is enabled in the Trace tab and the invocation completes successfully.
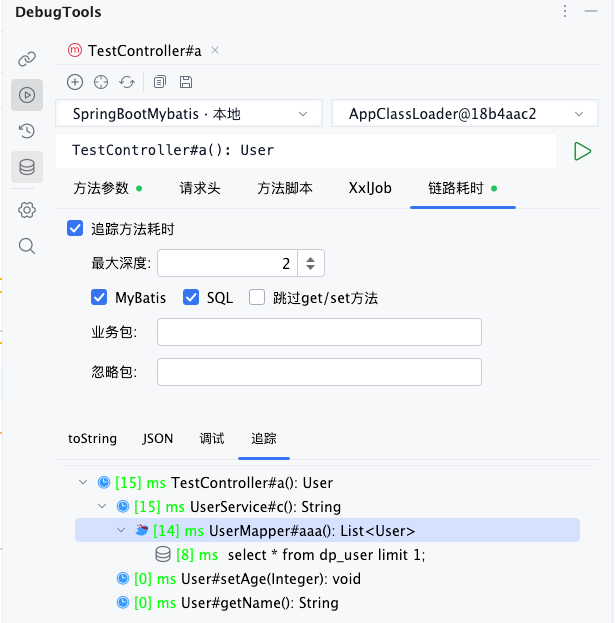
For detailed configuration, node descriptions, and result tree operations, see Trace.
Reactive
When the target method returns a Reactive type, the result area switches to the streaming result panel after the first streaming event arrives, instead of showing the normal toString, JSON, or Debug tabs.

For detailed configuration, extract path rules, and examples, see Reactive.
Parameter Cache and Invocation History
Click ![]() to save the current method parameter JSON, headers, XXL-JOB parameter, trace configuration, and selected script. The next time the same method is opened, the page restores these values automatically.
to save the current method parameter JSON, headers, XXL-JOB parameter, trace configuration, and selected script. The next time the same method is opened, the page restores these values automatically.
After a method invocation completes, if invocation history is enabled, DebugTools saves the request and result locally.
When you need to rerun a request, review a return value, inspect a failure stack, or reuse previous parameters for further debugging, open invocation history from the DebugTools tool window.
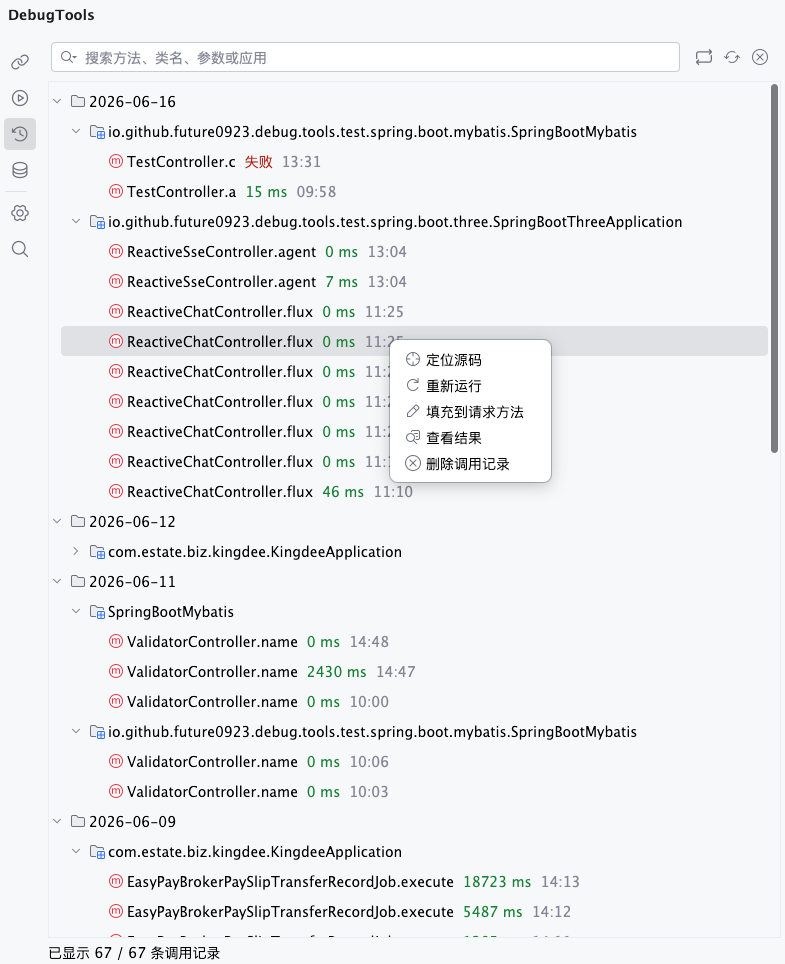
For detailed actions, see Invocation History.
WARNING
The method invocation page directly executes the current method in the target JVM. For methods that write to a database, send messages, call external services, or trigger scheduled jobs, confirm the application environment, headers, ClassLoader, and parameters before running.