
Connection Management
The connection management page is used to view and maintain all applications currently attached to DebugTools. Both local JVM attachments and remote service connections appear here as connection cards. Features such as method invocation, SQL printing, Groovy execution, and hot deployment are all based on a selected connection.
Open Connection Management
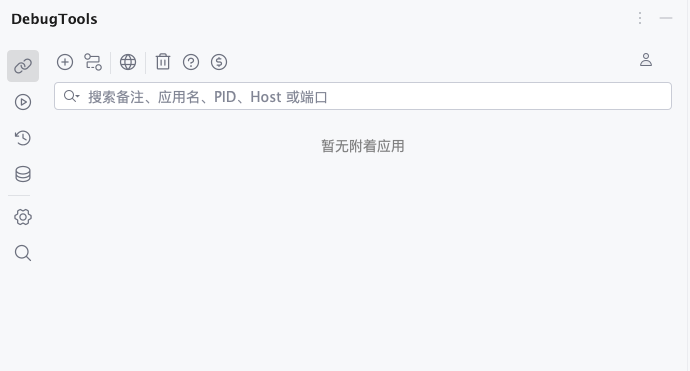
Open the DebugTools tool window in IDEA. By default, it opens the connection management page. If no application is attached, the page shows No attached applications.
The toolbar provides these actions:
| Icon | Button | Description |
|---|---|---|
Attach | Select and attach to a local Java process. | |
Connect | Connect to a remote DebugTools service. | |
Global Header | Configure default headers used by later calls. | |
Clear Cache | Clear the core Jar cache, method parameter cache, or all supported caches. | |
Help | Open the DebugTools documentation. | |
Sponsor | Open the sponsor entry. |
The search box supports filtering by remark, application name, PID, host, or port. When many connections are attached, add remarks to frequently used applications and search by remark later.
TIP
The account button uses the IDEA account icon. It is used to sign in or view IDEA plugin account information.
Attach Applications
Local
Click ![]() in the toolbar to open the local JVM process list. The dialog scans Java processes running on the current machine and selects an available process by default.
in the toolbar to open the local JVM process list. The dialog scans Java processes running on the current machine and selects an available process by default.
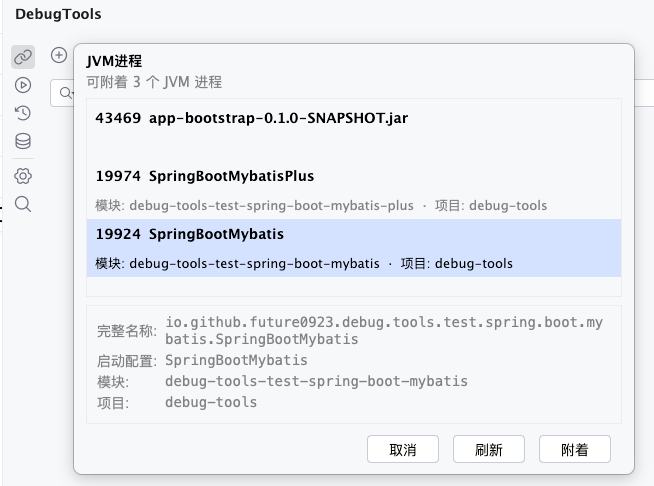
Each item in the list shows:
- PID: the process ID, for example
19924. - Application name: the short main class name is preferred; if the process is started from a Jar, the Jar file name is shown.
- Run configuration, module, and project: if the process comes from the current IDEA run configuration, these details are shown in the list.
- Full name: after selecting a process, the detail area shows the full main class name or Jar path.
You can attach in either of these ways:
- Double-click the target JVM process.
- Select the target JVM process, then click
Attach.
If the list is empty, make sure the Java application is running, then click Refresh to scan again. Click Cancel to close the dialog without attaching.
TIP
Local attach injects the DebugTools Agent into the target JVM. After attaching successfully, the application appears in the connection management list with the source marked as Local.
Remote
Click ![]() in the toolbar to open the remote target dialog. This is used to connect to a remote application where the DebugTools server has already started.
in the toolbar to open the remote target dialog. This is used to connect to a remote application where the DebugTools server has already started.
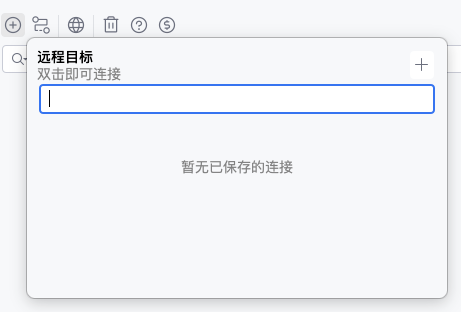
When there is no saved history, click ![]() to create a remote target.
to create a remote target.
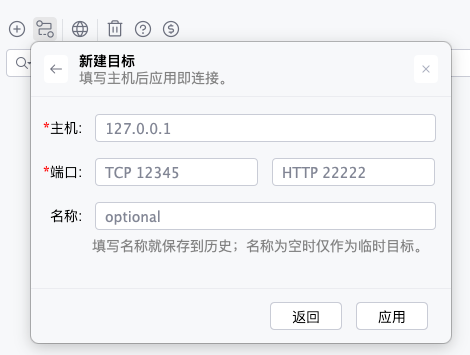
Fill in these fields:
Host: the address of the remote application machine. If empty,127.0.0.1is used by default.Port: fill in theTCPport andHTTPport. The default values are12345and22222.Name: optional. If filled in, the target is saved to the history list. If left empty, it is used only as a temporary one-time target.
After filling in the fields, click Apply. The plugin first gets the remote application name through the HTTP port, then establishes the connection through the TCP port. After the connection succeeds, the dialog closes and a remote connection card is added to the connection management list.
TIP
Before connecting remotely, make sure the target application has started the DebugTools server and that the current machine can access the target TCP and HTTP ports. Otherwise, the plugin may report connection failure or fail to get the application name.
Manage Remote History
If a Name was filled in when creating a remote target, it appears in the history list the next time the remote target dialog is opened.
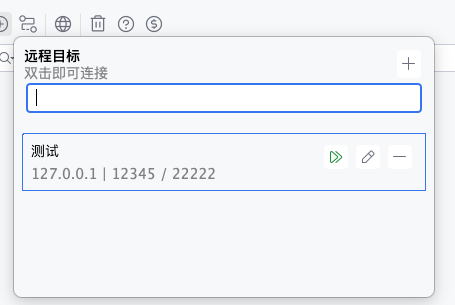
The history list supports:
- Filtering by name or host in the search box.
- Double-clicking a target to connect directly.
- Clicking
 to start a connection.
 - Clicking
 to modify the host, ports, or name.
 - Clicking
 to delete the history record.
After editing a history target, click Apply to connect with the latest configuration. If the name is changed, the history record under the old name is replaced by the new one.
View Connections
Application Information
After an application is attached, the connection is displayed as a card in the list.
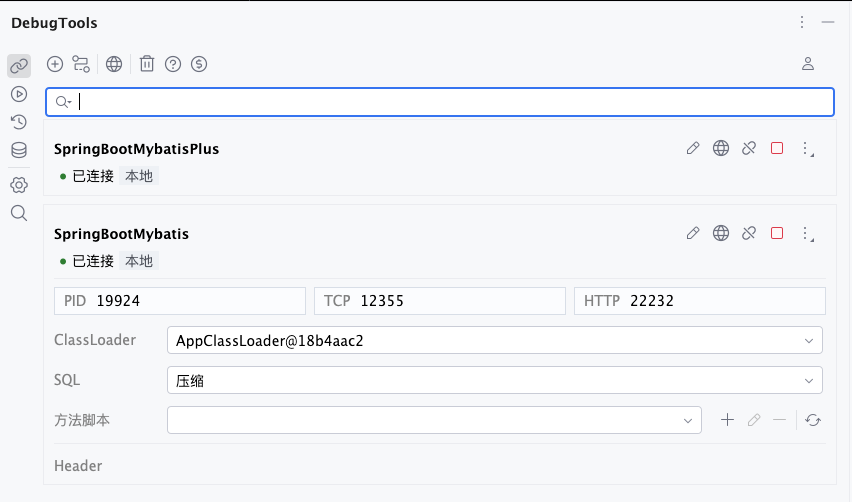
Each connection card shows:
- Application name: the short application name is shown by default. Hover to view the full name.
- Connection status: green means connected. When disconnected, the card is shown as not connected.
- Source tag: local attachments show
Local, and remote connections showRemote. - Runtime information: expand the card to view
PIDorHost,TCPport, andHTTPport.
Click the card title area or blank area to expand or collapse details. Buttons, dropdowns, input fields, and other operation controls do not trigger expand or collapse.
Remarks
Click the edit button on a connection card to modify its remark. After saving, the card title is displayed as Remark (ApplicationName), which makes it easier to distinguish environments when multiple applications are attached, for example Order Service Test (OrderApplication).
Press Enter to save the remark, or click the save button. Press Esc or click the cancel button to discard the change.
Header
The connection management page provides two types of headers:
- Configure through the toolbar
 entry to apply headers to all connected applications.
 - Click on a single connection card to configure headers that apply only to that connection.
After expanding a connection card, you can view the headers already saved for the current connection in the details area. This area is read-only. To modify headers, open the Header dialog from ![]() on the connection card.
on the connection card.
TIP
- If the same IDEA project connects to multiple applications, it is recommended to configure authentication, tenant, or environment headers on specific connections to avoid affecting other applications.
- Headers can also be configured per method on the method invocation page. For details, see Request Headers.
- Priority:
Method-level > connection-level > project-level.
Adjust Connection Configuration
After expanding a card, you can directly modify common call configuration for the current connection:
ClassLoader: select the ClassLoader used when invoking methods or executing scripts.SQL: switch the SQL printing mode.Method script: select the default Method Around script for the current connection, or add, view, delete, and refresh scripts. See Method Pre/Post Scripts.Header: view the current connection header key-value pairs.
These settings are saved per connection. When multiple applications are attached, each connection can maintain its own ClassLoader, SQL setting, method script, and headers.
Connection Actions
Connection cards show different actions depending on the connection status:
| Icon | Button | Scenario | Description |
|---|---|---|---|
Edit Remark | Connection card | Modify the remark of the current connection. After saving, the title is shown as Remark (ApplicationName). | |
Project Header | Connection card | Configure headers for the current connection. | |
Disconnect | Connected | Close only the client connection for the current card. The connection record remains in the list. | |
Stop | Connected | Send a stop command to the current connection. Use this when the current attached service needs to be ended. | |
Reconnect | Disconnected | Local connections search for the JVM again by application name. Remote connections reconnect using the original host and ports. | |
More | Connection card | Contains SQL history, Groovy console, hot deployment, and delete connection actions. |
The More menu contains:
| Icon | Button | Description |
|---|---|---|
SQL History | Open the SQL history for the current application. | |
Groovy Console | Open the Groovy console bound to the current connection. | |
Hot Deployment | Open the hot deployment window for the current connection. | |
Delete Connection | Delete the current connection record. |
Deleting a connection opens a confirmation dialog. After deletion, the connection record is removed from the list.
Clear Cache
Click ![]() to open the cache cleanup menu. Select the cache items you want to clear, then click
to open the cache cleanup menu. Select the cache items you want to clear, then click Clear. Click Cancel to close the menu without clearing anything.
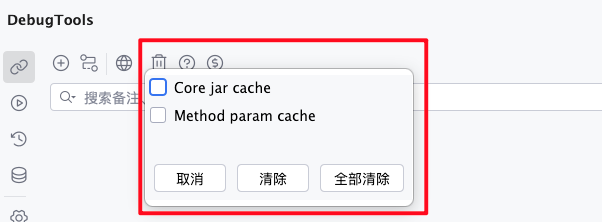
The supported cache items are:
Core jar cache: clears the core Jar cache used when DebugTools injects into the target JVM. After upgrading the plugin, when attach fails, or when you suspect the local Agent cache is inconsistent, clear this item and attach the application again.Method param cache: clears the method invocation parameter cache. After clearing it, reopening the same method invocation page will no longer restore the previously filled parameters, headers, scripts, and other request form content.
Click Clear all to clear the core Jar cache, method parameter cache, and Global Header settings at once. After the cleanup finishes, IDEA shows a success notification.
WARNING
Clearing cache does not disconnect current connections and does not delete remote connection history. However, Clear all clears the default headers saved through the Global Header entry, so make sure those headers are no longer needed before running it.