
Invocation History
Invocation history saves method invocation requests and execution results. When it is enabled, every request sent from the method invocation page is saved locally with the target method, application, ClassLoader, parameter JSON, headers, pre/post script names, running state, duration, and result snapshot.
It is useful when you need to verify the same method repeatedly, reuse the previous parameters, inspect why a recent invocation failed, or jump back from a history record to source code.
Open Invocation History
In the DebugTools tool window, click ![]() to open the invocation history page.
to open the invocation history page.
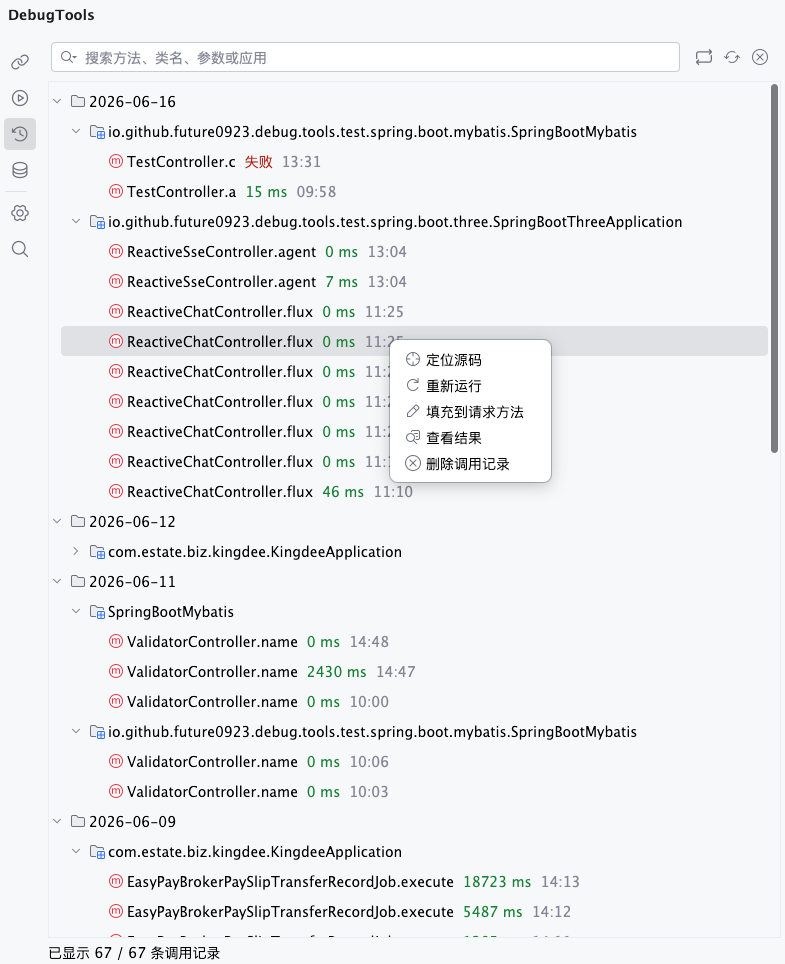
The page opens in tree view or list view according to your settings. Tree view groups records by date and application, which is useful when you want to find a method from one application's invocations on a specific day.
List view shows records directly, which is useful for scanning status, method, application, and time.
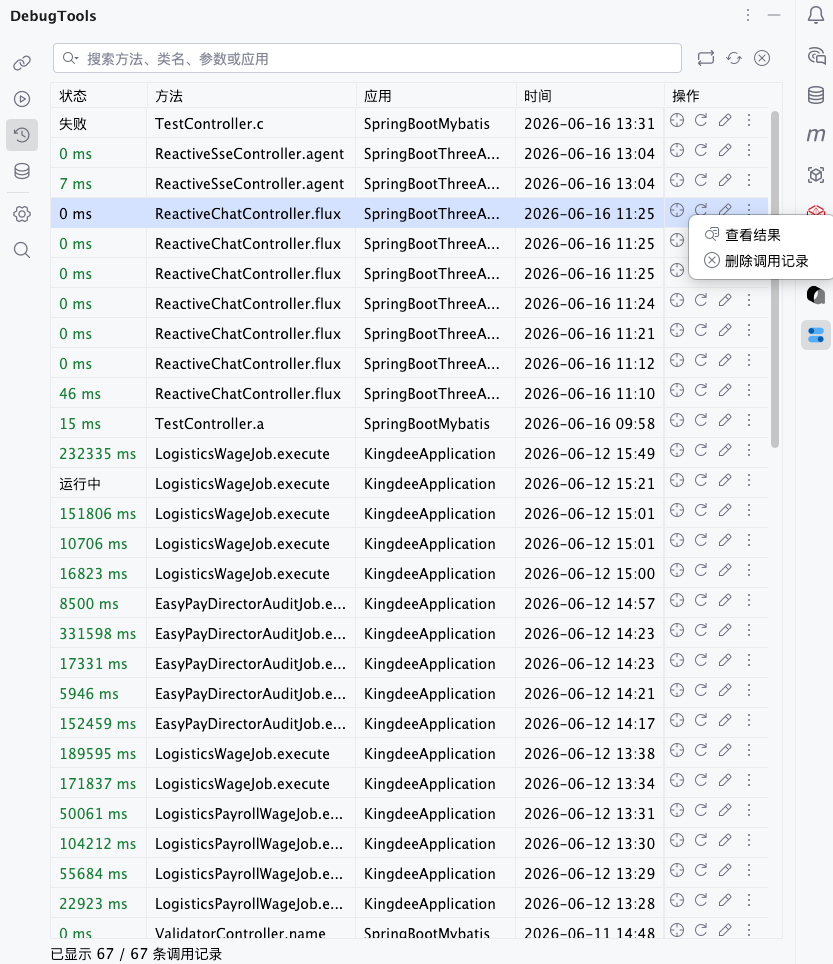
The search box at the top can search method names, class names, parameters, and application names.
Common Actions
| Icon | Button | Description |
|---|---|---|
Switch list/tree | Switch between list view and tree view. | |
Refresh | Reload local invocation history. | |
Clear records | Delete all invocation records after confirmation. | |
Locate source | Jump to the source method according to the class name, method name, and method descriptor in the record. | |
Rerun | Invoke the target method again using the request content saved in the history record. | |
Fill to method request | Open the corresponding method request page in the detail area and restore parameters, headers, scripts, and other request data from the record. | |
View result | Show the return result or exception stack saved in the selected record. |
In tree view, if you select a date or application group and delete it, DebugTools deletes the records under that group after confirmation.
Rerun
After clicking ![]() , DebugTools directly invokes the target method again with the request snapshot saved in this history record.
, DebugTools directly invokes the target method again with the request snapshot saved in this history record.
Rerun reuses the saved target application, ClassLoader, parameter JSON, headers, XXL-JOB parameter, Trace Method configuration, and pre/post scripts. It does not open the request editor first and does not let you change parameters; the request is sent immediately after you click the button.
Use rerun when you want to try the exact same parameters again, for example after the previous request failed. The new invocation creates a new running record. If invocation history deduplication is enabled in settings, the new record may be merged into an existing one according to the deduplication rule.
TIP
If you need to change parameters, headers, or scripts before invoking, use ![]() instead of rerun.
instead of rerun.
Fill to Method Request
After clicking ![]() , DebugTools opens the method invocation page for this history record in the detail area and fills the saved request content back into the editor.
, DebugTools opens the method invocation page for this history record in the detail area and fills the saved request content back into the editor.
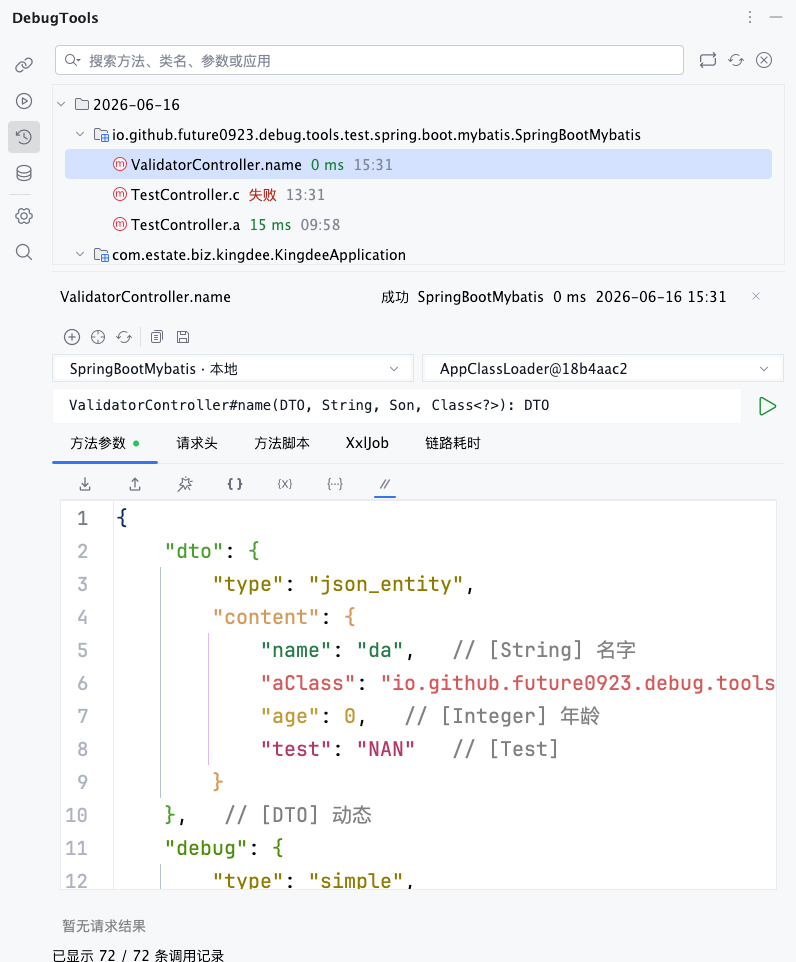
Restored content includes parameter JSON, headers, ClassLoader, XXL-JOB parameter, Trace Method configuration, and pre/post scripts. It does not run automatically after filling. You can adjust parameters, switch ClassLoader, add or remove headers, or change scripts before starting the invocation manually.
This action locates the source method in the current project using the class name, method name, and method descriptor saved in the history record. It can open the corresponding request page only when the method still exists and the signature still matches. If the method has been deleted, renamed, or its parameter signature has changed, filling back to the request page may fail.
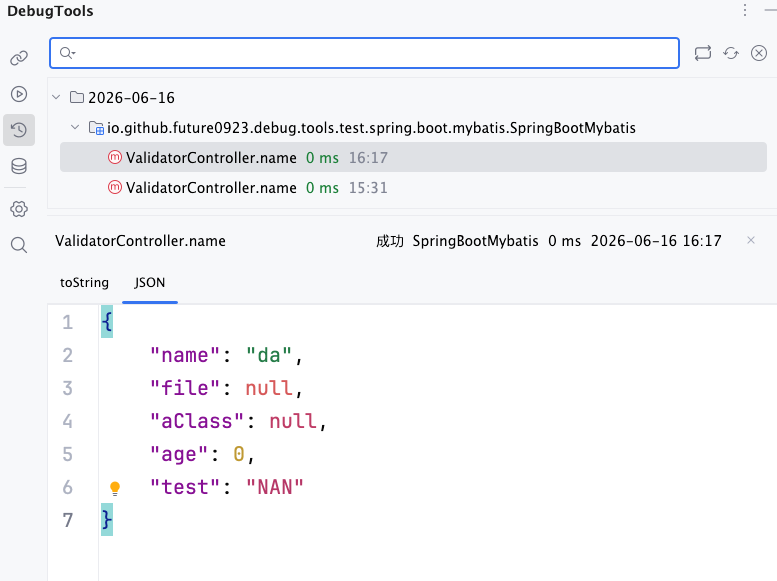
View Result
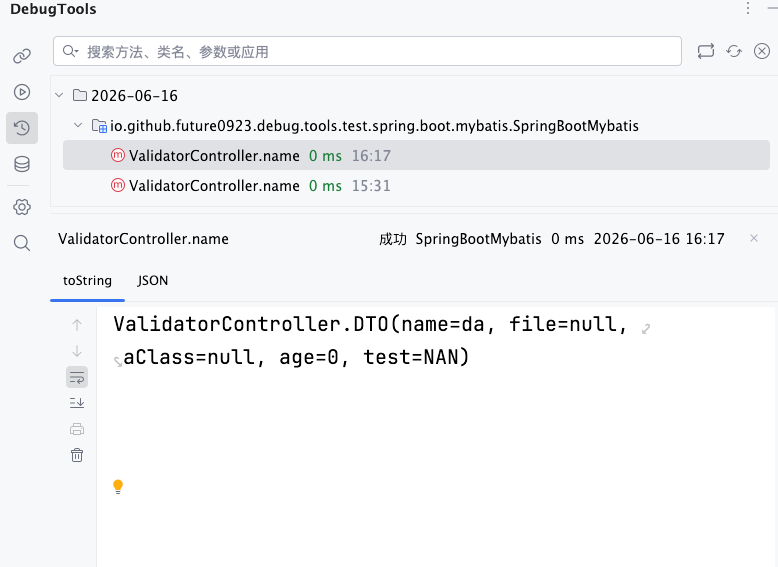
After clicking ![]() , the detail area shows the execution result saved in this history record. It only reads local history. It does not invoke the target method again and does not modify the record.
, the detail area shows the execution result saved in this history record. It only reads local history. It does not invoke the target method again and does not modify the record.
The toString result is shown by default:
If you clicked the JSON tab during execution, the history result can also switch to the JSON editor:
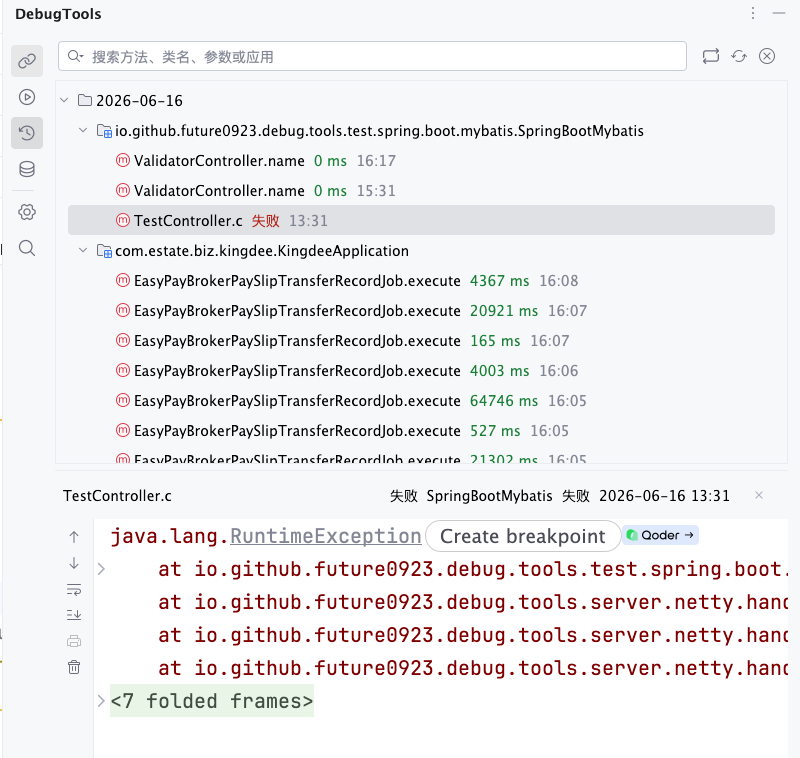
For failed executions, you can view the exception stack saved from that invocation:
Local Storage and Limits
Invocation history is saved under the current user's home directory:
~/.debugTools/invoke-record/TIP
- The number of saved records is limited: up to the latest 20 records per day and the latest 100 records in total.
- When the limit is exceeded, older records are naturally replaced by newer ones.
Settings
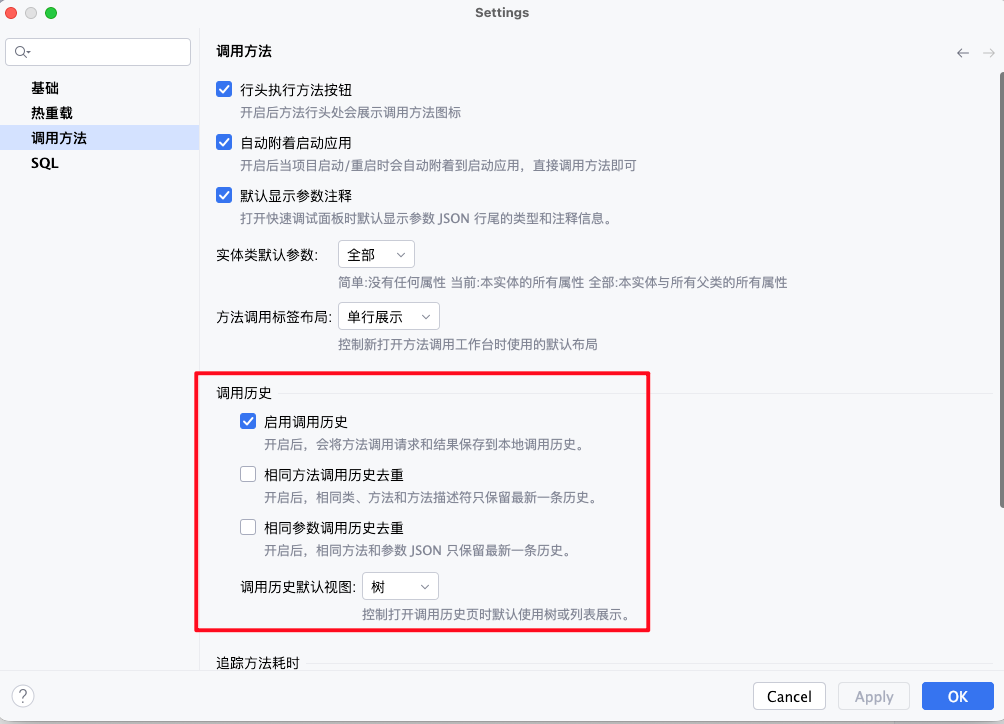
In the DebugTools tool window, click ![]() to open settings. Go to the
to open settings. Go to the Method Invocation page and adjust options in the Invocation History group:
| Setting | Default | Description |
|---|---|---|
Enable invocation history | On | Saves method invocation requests and results. When disabled, no new records are added or updated. Existing records are not deleted automatically. |
Deduplicate invocation history by same method | Off | Merges history by method. Records are considered the same method when class name, method name, and method descriptor are the same. Even if parameter JSON differs, only the latest invocation is kept. |
Deduplicate invocation history by same parameters | Off | Merges history by method and parameter JSON. Only the same method with the same parameter JSON overwrites an old record. Different parameter JSON values are kept separately. |
Default invocation history view | Tree | Controls whether the invocation history page opens in tree view or list view. |
You can understand the two deduplication options as "what should be used as the unique key for a history record":
| Configuration | Best For | After invoking id=1, id=2, id=1 in order, DebugTools keeps |
|---|---|---|
| Both disabled | Keeping every invocation process | 3 records |
Only Deduplicate invocation history by same method enabled | Keeping only the latest result for each method | 1 record: the latest invocation |
Only Deduplicate invocation history by same parameters enabled | Merging repeated retries with exactly the same parameters | 2 records: id=2 and the latest id=1 |
| Both enabled | Same as enabling only Deduplicate invocation history by same parameters; it merges by method and parameter JSON | 2 records: id=2 and the latest id=1 |