
Trace
The Trace tab on the method invocation page enables Trace collection for the current method invocation.
It is useful when you need to identify where a method spends time, whether the invocation enters the expected Service or Mapper, or whether a SQL statement is slow.
WARNING
- After Trace is enabled, DebugTools temporarily enhances the target method and its call chain in the target JVM, records the execution time of traced methods, and displays the result as a trace tree.
- If you only need to verify the return value, keep Trace disabled. The wider the collection range is, the higher the extra collection overhead in the target JVM.
- The first invocation may take longer because bytecode enhancement is performed first. When the configuration is unchanged, use the second invocation as the more reliable timing reference.
Entry Point
Open the Trace tab on the method invocation page, then select Trace method execution time and configure the trace range for this invocation.
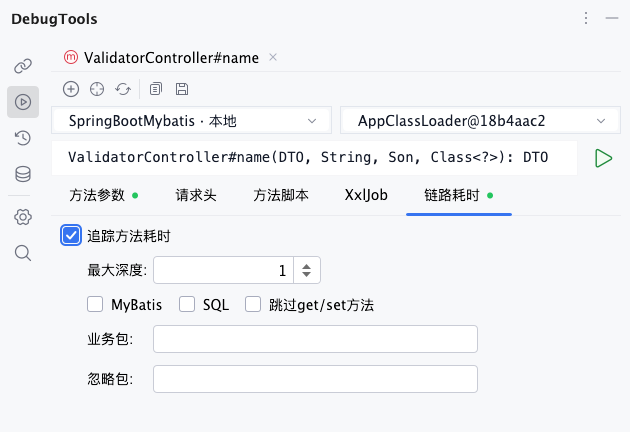
Options
| Option | Description |
|---|---|
Trace method execution time | Enables Trace for the current method invocation. If it is not selected, no trace result is generated. |
Max depth | Controls how deep DebugTools resolves the call chain from the target method. The default value is 1. A larger value shows more levels, but also enhances more methods. |
MyBatis | Traces MyBatis Mapper calls. When enabled, Mapper method nodes appear in the trace tree. |
SQL | Adds executed SQL statements to the trace tree. SQL nodes show the final SQL and execution time. |
Skip get/set method | Skips Java Bean getter and setter methods to reduce noise. |
Business package | Only traces classes matching this expression. Empty means no business package restriction. |
Ignore package | Excludes classes matching this expression. Empty means no exclusion. |
Max Depth
Max depth controls the trace range. The default value 1 is suitable for first checking the target method and nearby downstream calls. If the result is too shallow, increase it gradually.
Do not start with a very large value. If the target method has a long call chain, a large depth causes more classes to be enhanced and makes the trace tree harder to read.
MyBatis And SQL
MyBatis and SQL are separate switches:
MyBatisrecords Mapper method calls, such as which Mapper and method were entered.SQLrecords the actual executed SQL text and SQL execution time.
If you only need to inspect business method calls, leave them disabled. If you are analyzing database-related latency, enable both MyBatis and SQL so the trace can show the path from business method to Mapper and SQL.
TIP
SQL nodes depend on DebugTools SQL interception. The target application must already be running with the DebugTools Agent for SQL to be recorded in Trace.
Business Package And Ignore Package
Business package and Ignore package use Java regular expressions to match fully qualified class names.
Common example:
com\.example\..*Only trace the order module:
com\.example\.order\..*Exclude infrastructure packages:
com\.example\.common\..*Prefer setting Business package first to limit tracing to your business code. Add Ignore package only when some packages create obvious noise.
WARNING
Avoid overly broad expressions such as .*. They make DebugTools try to trace many classes, which can slow down the invocation and produce a very large trace tree.
Default Trace Settings
In Settings -> Method Invocation -> Trace Method Execution Time, you can configure the default Trace parameters used when the method invocation panel is opened.
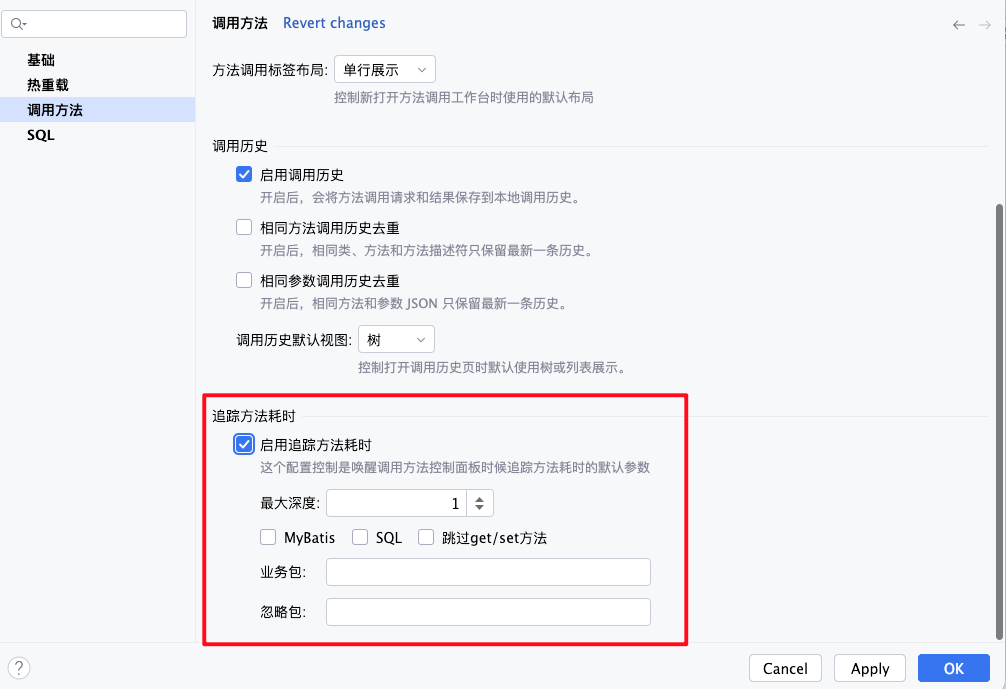
These settings are stored in the plugin global settings and control the default state of the Trace tab for newly opened method invocation panels:
| Option | Description |
|---|---|
Enable trace method execution time | Controls whether Trace method execution time is selected by default on the method invocation page. When enabled, newly opened invocation panels enable Trace by default. |
Max depth | Default trace depth. Keep it small, such as 1 or 2, then adjust per invocation when needed. |
MyBatis / SQL / Skip get/set method | Controls whether Mapper calls and SQL are traced by default, and whether getter/setter methods are filtered. |
Business package / Ignore package | Default package filter expressions. Configure the common business package here to avoid entering it repeatedly. |
If a method already has saved request parameters, the method-level cached Trace configuration is restored for that method and takes precedence. After clearing Method param cache, newly opened method invocation panels use these global defaults again.
Trace A Specific Method
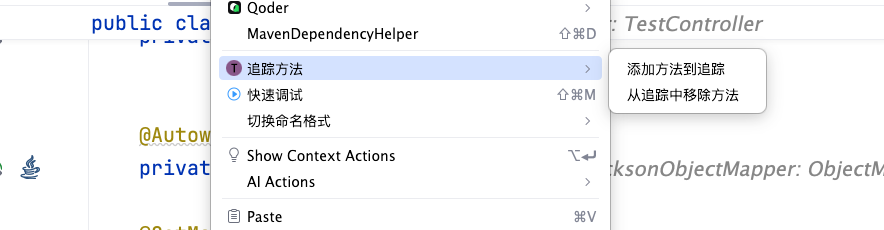
Besides enabling Trace for the current invocation on the method invocation page, you can also add a specific method to Trace from the editor.
Open the context menu inside a Java method and choose Trace Method:
| Action | Description |
|---|---|
Add Method To Trace | Adds the method at the current caret position to Trace in the target application. The plugin sends the class name, method name, and method descriptor to the attached application, and the target JVM enhances that method for tracing. |
Remove Method From Trace | Cancels Trace for the current method. The target JVM removes the trace enhancement for that method, and the plugin removes the local trace state. |
After a method is added to Trace, a Trace icon appears in the method gutter. Click this icon to quickly cancel Trace for the method. This is equivalent to choosing Remove Method From Trace from the context menu.
![]()
TIP
- If only one application is attached, the operation is sent directly to that connection.
- If multiple applications are attached, DebugTools shows
Choose Attached Application, and you need to select the target connection. - If no connection is available, attach or connect to an application first.
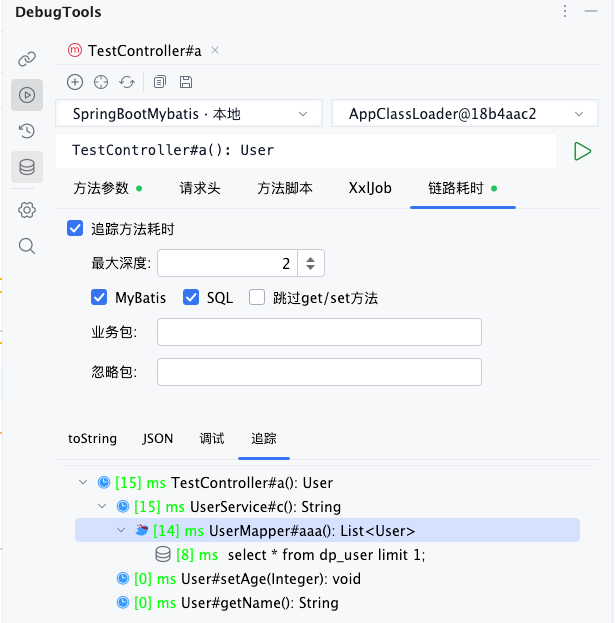
View Trace Results
After the invocation completes, if Trace method execution time was enabled, the result area shows a Trace tab.
Display
When you switch to the Trace tab, DebugTools loads the trace tree from the target application. The tree contains three node types:
| Node | Description |
|---|---|
| Method node | A normal Java method call. It shows the class name, method signature, and execution time. |
| MyBatis node | A Mapper method call. It appears when MyBatis is enabled. |
| SQL node | An actually executed SQL statement. It appears when SQL is enabled. |
The execution time before each node is displayed in milliseconds. Nodes whose time exceeds 100ms are shown in red so slow calls are easier to identify.
Trace Tree Operations
- Expand a node to inspect downstream calls.
- Open the context menu on a method node to navigate to the corresponding source method.
- Open the context menu on a SQL node, or double-click the SQL node, to view the complete SQL.
TIP
Trace results are loaded separately from the normal return value. The plugin reads the trace tree from the target application only when you switch to the Trace tab.
Usage Recommendations
- Start with a small
Max depth, identify the likely slow direction, then increase the range gradually. - Prefer
Business packageto keep framework, JDK, and third-party library calls out of the trace. - Enable both
MyBatisandSQLwhen analyzing database issues. - After debugging, if Trace is no longer needed, disable
Trace method execution timebefore saving request parameters so the same method does not keep collecting Trace by default next time.
WARNING
Trace temporarily enhances related methods in the target JVM and records the call tree. Do not use a broad trace range casually in high-concurrency production environments. For methods that write databases, send messages, or call external services, verify the invocation parameters and environment first.